Frequency
1 in 1,710
turbines / year
Upper research estimate. Public logs capture closer to one fire in ten of those events.
Open assessment · compiled 2026
Environmental assessment · interactive figures
Wind turbines do not generate electricity by burning fuel. They do, occasionally, catch fire — usually in the nacelle, usually beyond the reach of hoses. This study pulls the published frequencies, soil-burn measurements, wildfire case reports, and the other side of the ledger (avoided air pollution and carbon) into one set of interactive figures.
Frequency
1 in 1,710
turbines / year
Upper research estimate. Public logs capture closer to one fire in ten of those events.
Loss given fire
90%
total or near-total
Once the nacelle is alight, height and oil load usually finish the machine.
Air-quality dividend
231
deaths avoided, US 2014
One year of RPS-linked wind, 95% CI 146–318 — orders of magnitude above fire casualties.
Carbon payback
< 2 yr
versus gas turbines
A typical onshore farm offsets its 30-year manufacturing footprint in 1.5–1.7 years.
01 · Incidence
Public logs and insurance notes undercount. Accident researchers who reconstructed 30 years of the global fleet put the true rate about ten times higher than headlines — still rare per machine, material across hundreds of thousands of towers.
Figure 1
Reported series follows CWIF / media compilations (≈12/year through 2012, rising toward the mid-20s). Estimated series scales the Imperial College–Edinburgh–SP finding that ~91% of fires never appear in public logs, anchored at 117 events around 2011–12. Later years are an indicative continuation, not a new census.
Per-turbine rate
1 / 1,710–2,000
per year, research vs conservative
Share of accidents
2nd
after blade failure (~19% vs fire ~15%)
Unreported share
~91%
if the 117 vs 12 reconstruction holds
02 · Mechanism
Reviews rank ignition sources rather than publishing a complete global census. The shares below are a synthesis of that ranking (lightning, electrical, mechanical, maintenance) totaling 100% so the figure is readable — treat them as relative weights, not a single registry extract.
Figure 2
Oil-soaked acoustic foam, gearbox and transformer oil, and a glass-reinforced nacelle shell turn a small electrical event into a total loss.
Figure 3
Fire is not the most common accident. It is the most expensive common one: 90% of nacelle fires destroy the machine.
03 · The nacelle
A nacelle is a sealed room the size of a small bus, packed with a gearbox, hydraulics, a transformer, and foam lining that becomes kindling once it is soaked with oil. Firefighters on the ground hold the perimeter. They almost never put water on the fire.
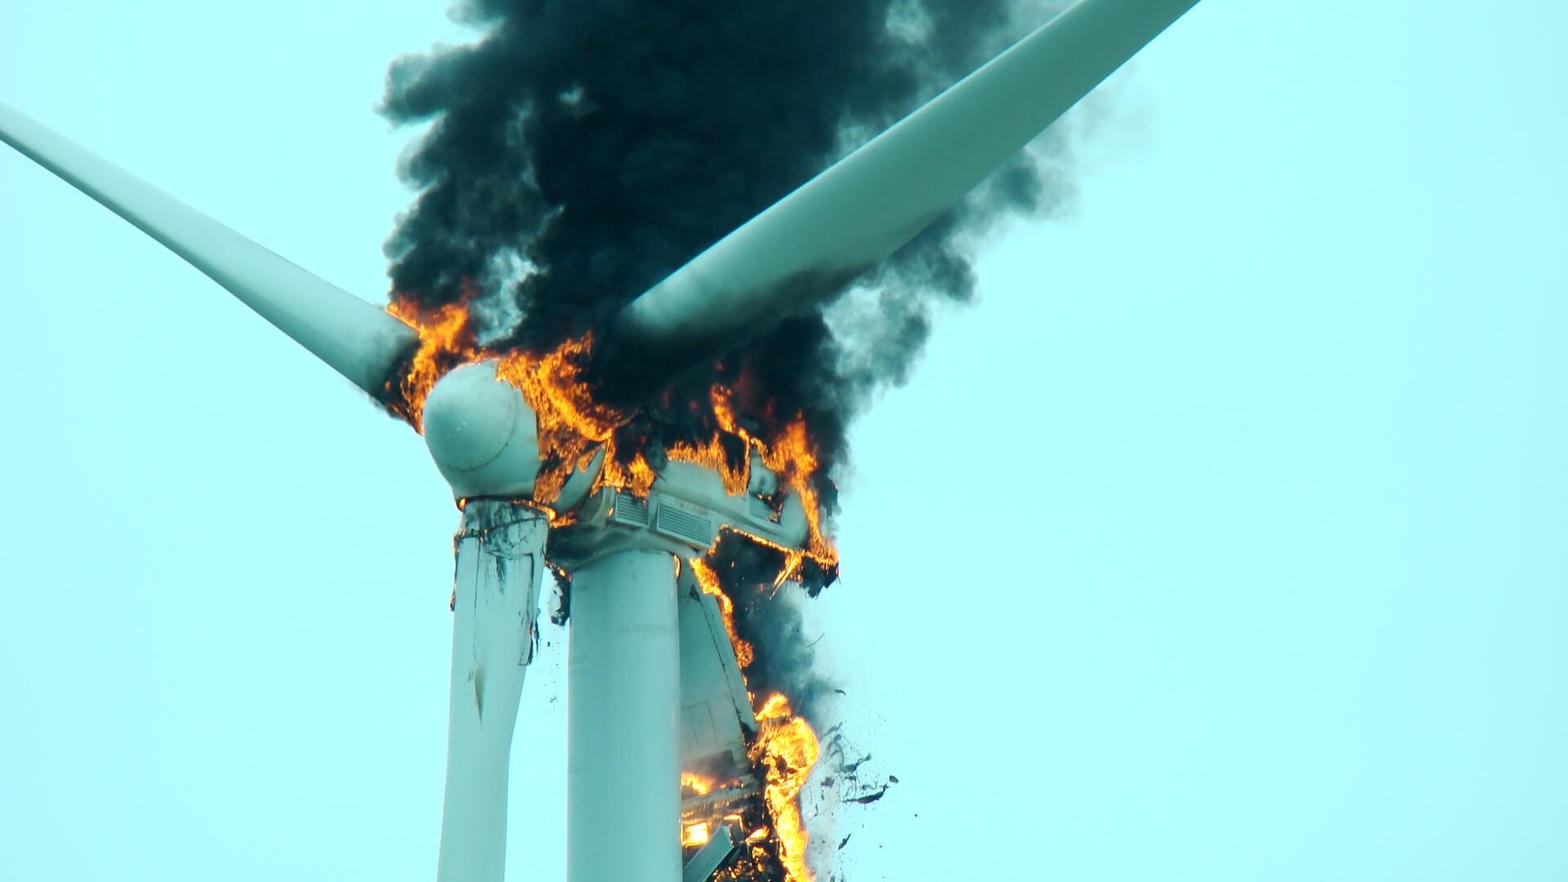
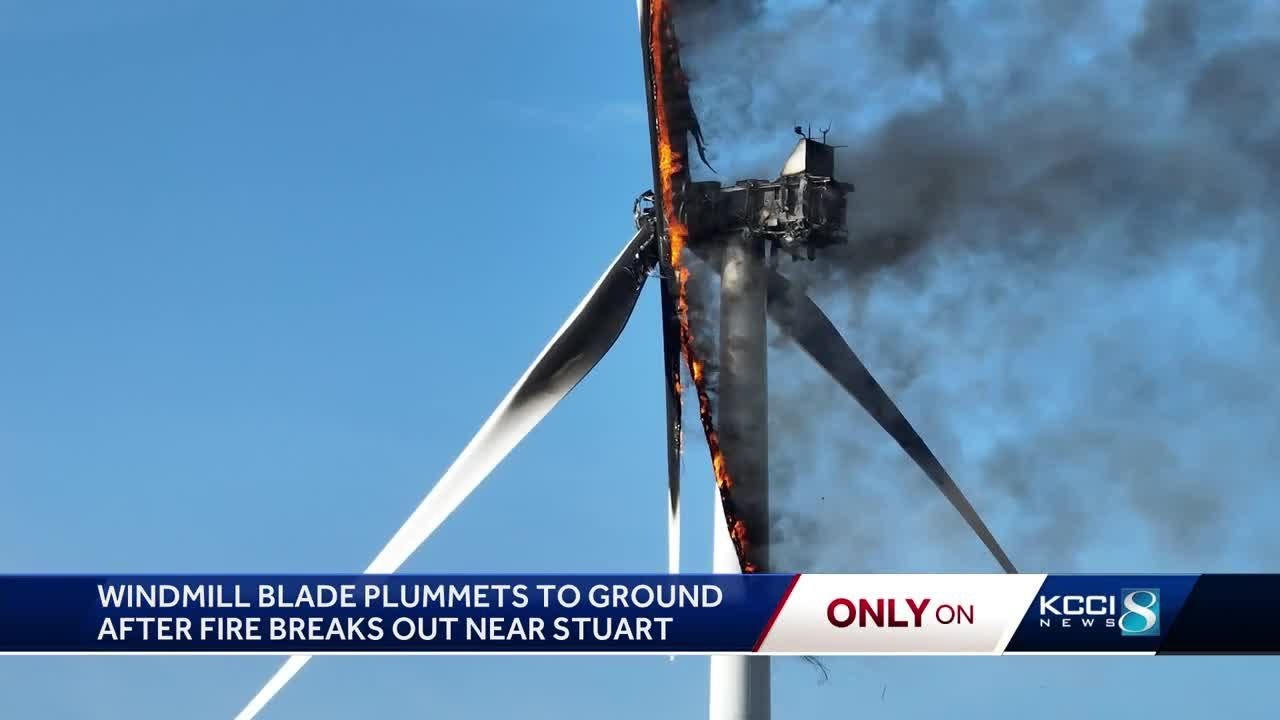
Figure 4 · interactive
1,300 L
Range 200–2,000 litres · reference case 1,300 L
Burning area
150 m²
worst-case pool, no soak-in
Vs football pitch
2.1%
association pitch ≈ 7,140 m²
Scaled from the Earthdoc trial: 1,300 L of turbine oil produced a ~150 m² burning pool on sandy soil (absorption ignored — worst-case). Drag the slider to resize the inventory.
04 · Ground
The 2022 field burn found a 22-minute free-burning oil fire. Surface soil hit 130 °C immediately after, then 70 °C six minutes later. Oil coked the top 5 cm and showed up heterogeneously to 30 cm. Around turbines that sit in cropland, that is a topsoil-replacement problem, not a scorch mark.
Figure 5
Flame temperature is the midpoint of the 680–710 °C range. The remaining points are measured soil temperatures from the sandy-loam experiment.
05 · Escape
A nacelle fire is usually a single-machine loss plus spot grass fires. The large 2026 Greek burn was not a nacelle event — investigators tied it to defective overhead collector lines. That distinction matters: electrical infrastructure, not the rotor, is the wildfire pathway with real acreage.
Figure 6
Log scale is the honest default: Attica–Boeotia (collector line) is three orders of magnitude above typical nacelle debris fires. The 80,000-hectare figure sometimes attached to Lake Bonney (2006) is not used here; contemporaneous reporting describes a local grass fire from falling debris.
Lake Bonney, South Australia · Jan 2006
NacelleFalling debris ignited grass beneath a Vestas turbine. Extent of the grass fire was local; later claims of tens of thousands of hectares are not corroborated.
Pubnico Point, Nova Scotia · 2019
NacelleTwo blades and nacelle damaged; burned out in about two hours.
Clements Gap, South Australia · 2023–24
Nacelle + grassDestroyed a turbine and burned about 30 hectares of farmland.
Mavro Spithari, Greece · 27 Jun 2026
Collector lineShort circuit on the farm’s private overhead line; ~12 acres.
Pubnico Point, Nova Scotia · 21 Jul 2026
NacelleFull loss of hub, nacelle and blades on a 78 m V80. Spot fires in grass only.
Attica–Boeotia, Greece · 31 Jul 2026
Collector line~35,000 acres, ~200 homes. Investigators tied ignition to defective overhead lines serving a new wind farm.
Greater Changhua 4, Taiwan · 8 Aug 2026
Offshore nacelleDetected, tripped, and extinguished by the operator. No injuries, farm otherwise online.
06 · The other column
A nacelle fire is photogenic. The air-quality paper is not. One year of US wind tied to renewable portfolio standards was estimated to avoid 231 premature deaths and 32 million tonnes of CO₂ — a public-health dividend that swamps the fire record.
Figure 7
Air quality alone US$2.0 billion. Total with carbon and fuel savings ~US$5.0 billion. Targeting the dirtiest thermal plants first could raise health benefits to US$8.4 billion — without closing exposure gaps by itself.
Figure 8
Each bar is the percentage of US power-sector emissions avoided that year by RPS-linked wind (right axis conceptually 1.3–1.6%). Absolute tonnes are in the tooltips.
Figure 9
10.8 gCO₂eq/kWh in a New Zealand onshore case. Manufacturing dominates. Recycling blades could trim that toward 9.7 g.
Twenty-nine percent of those US health benefits accrued to racial/ethnic minority populations and 32% to low-income groups — below a later 40% disadvantaged-community target. Wind improved exposure gaps in some states and worsened them in others.
07 · Siting
Life-cycle studies that skip land-use change understate forest sites. In one Chinese comparison, land-use change was 37.9% of a forest farm’s life-cycle emissions versus 1.2% on desert. Inner Mongolia’s clustered build-out also lifted nighttime land-surface temperature by 0.23 °C and cut net primary productivity.
Figure 10
1.2 km² in 1990 to 10,755 km² in 2020. Nighttime warming 0.23 °C; NPP −12.37 gC/m², largest over forest.
Figure 11
Forest siting is a different climate project than desert siting. Filter the ecosystem to isolate a class.
Figure 12
China-wide modelling, summer 2015–2018: PM₂.₅ rose 4.39 µg/m³ in the northeast and fell 3.27 µg/m³ in the southeast as mesoscale winds shifted.
08 · Collision
Fires are rare pulses. Blade strike and barotrauma are the chronic ecological cost. US-scale reviews put annual fatalities near 679,000 birds and 888,000 bats, with enormous site-to-site variance.
Figure 13
Per-turbine literature ranges run 0–125 birds and 0–287 bats per year. Collision risk tracks season, weather, turbine layout, and species — not a single national rate.
09 · Scale it
Set the global (or regional) turbine count, pick a fire rate, and pick a unit cost. This is an expected-value sketch — it does not forecast a specific farm, and it does not price wildfire escaped from collector lines.
Turbine count
Expected fires / year
216.4
5.85 per 10,000 machines
Expected total losses
194.7
90% of fires destroy the nacelle
Expected annual cost
$974M
at US$4.5M each, downtime included
Even at the high rate, a 370,000-machine fleet implies on the order of a couple of hundred fires a year worldwide — against a technology whose US air-quality paper alone counted 231 avoided deaths in a single year.
10 · Methods
Figures are compiled from the papers and incident reports listed below. Where a study published a range, the midpoint or both bounds are shown. Cause shares and the post-2012 ‘estimated’ fire series are syntheses, labelled as such in the captions. This is not a new meta-analysis and does not replace site-level environmental impact assessment.
01 · Imperial / Edinburgh / SP Technical (2014–2023)
30-year accident review (~200,000 turbines). Media logged ~12 fires/year; researchers estimated ~117/year (~91% unreported). Fire is the second-largest accident class after blade failure; ~90% of nacelle fires are a total or near-total loss.
02 · Caithness Windfarm Information Forum (2012)
200 reported fire incidents 1995–2012 (avg 11.7/year). Fire ~12.5–15% of reported accidents; blade failure ~19%.
03 · GCube Underwriting (2015–2025)
Average insured cost of a turbine fire ~US$4.5 million (replacement + downtime). Later industry notes cite US$7–8 million.
04 · Earthdoc soil-fire experiment (2022)
Field burn of ~1,300 L turbine oil on sandy soil. Combustion area ~150 m². Surface 680–710 °C; 81 °C at 20 cm; oil coking to 5 cm and impregnation to ~30 cm.
05 · US wind & air quality (2011–2017) (2024)
Wind associated with 2014 RPS: US$2.0 billion air-quality health benefits, 231 premature deaths avoided (95% CI 146–318), 32 Mt CO₂, 51 kt SO₂, 25 kt NOₓ avoided. Total monetized benefits ~US$5.0 billion.
06 · Onshore LCA payback (NZ case) (2024)
10.8 gCO₂eq/kWh; greenhouse-gas payback 1.5–1.7 years versus combined-cycle gas; energy payback 0.4–0.5 years. Manufacturing dominates the carbon footprint.
07 · Inner Mongolia remote-sensing study (2024)
Wind-farm area 1.2 km² (1990) to 10,755 km² (2020). Nighttime land-surface temperature +0.23 °C; net primary productivity down 12.37 gC/m², strongest over forest.
08 · China plant biomass (2,404 farms) (2023)
NDVI and productivity decline within 1–10 km of farms. Average forest carbon-sink loss 12,034 t per farm (~US$1.81 million).
09 · China land-use LCA (2025)
Land-use change is 37.9% of life-cycle emissions on forest sites, 4.3% on grassland, 1.2% on desert. Biomass carbon loss 243.88 t C/turbine (forest), 9.95 (grass), ~5 (desert).
10 · Onshore wind environmental review (2024)
US annual collision estimates: ~679,000 birds and ~888,000 bats. Fatality ranges 0–125 birds and 0–287 bats per turbine per year.
11 · China mesoscale air-quality modelling (2024)
Farms do not add emissions but redistribute pollutants via circulation changes: PM₂.₅ +4.39 µg/m³ in the northeast, −3.27 µg/m³ in the southeast (2015–2018).
12 · Attica–Boeotia wildfire investigation (2026)
July 2026 fire of ~35,000 acres / ~200 homes attributed to defective overhead collector lines from a newly commissioned wind farm. A smaller short-circuit fire (~12 acres) had occurred on the same line on 27 June.
13 · Pubnico Point, Nova Scotia (2026)
21 July 2026 nacelle fire on a 2005 Vestas V80 farm (17 turbines, 30.6 MW, 78 m hub). Fire crews could not reach the nacelle; they held the perimeter. Spot grass fires only. Prior nacelle fire at the same site in 2019.
14 · South Australia turbine-fire record (2006–2024)
Clements Gap nacelle fire also ignited ~30 ha of grassland. Earlier losses at Cathedral Rocks, Starfish Hill, Lake Bonney (2006, falling debris started a grass fire).
Suppression systems, vegetation buffers, and underground collector lines are the practical mitigations the same literature keeps returning to.